Multimodal Training: Combining Tabular, Text, and Image
Here, we will be exploring multi-modal training. That is, training a model on multiple different types of data. For example, we can train a model to predict some output based on both text and images. We will be using a subset of a dataset from PetFinder.my a Malaysian website that matches adopters with homeless pets. The dataset contains images of pets, as well as some text-based description of the pets, and finally some tabular data.
So here, the task will be to predict the speed at which a pet will be adopted. This is formed here as a classification task with 4 different classes, where the classes are the number of days it took for the pet to be adopted.
To download the data for this part of the tutorial, use this link.
Note
Here we have combined the 5 classes from the original dataset into 4 classes for this tutorial, as one of the classes was very small compared to the others. However, the original classes are still available in the main tabular file.
After downloading the data, the folder structure should look like this (note that we will create the configuration files ourselves in the tutorial as we go along):
eir_tutorials/a_using_eir/07_multimodal_tutorial/
├── conf
│   ├── 07_apx-a_input_description_pretrained.yaml
│   ├── 07_apx-b_mt_input_tabular.yaml
│   ├── 07_apx-b_mt_output.yaml
│   ├── 07_fusion_attention.yaml
│   ├── 07_fusion.yaml
│   ├── 07_globals.yaml
│   ├── 07_input_description.yaml
│   ├── 07_input_image.yaml
│   ├── 07_input_tabular.yaml
│   └── 07_output.yaml
└── data
    ├── descriptions.csv
    ├── images
    └── tabular.csv
We are in for a relatively long tutorial, so I’ll try to keep it concise. Let’s get started!
A - Tabular Data
First, we will start training only on the tabular data, which is stored in a CSV file. Note that here the tabular data has been transposed, for visual purposes.
| ID | 86e1089a3 |
|---|---|
| Type | Cat |
| Name | Nibble |
| Age | 3 |
| Breed1 | Tabby |
| Breed2 | 0 |
| Gender | Male |
| Color1 | Black |
| Color2 | White |
| Color3 | 0 |
| MaturitySize | Small |
| FurLength | Short |
| Vaccinated | No |
| Dewormed | No |
| Sterilized | No |
| Health | Healthy |
| Quantity | 1 |
| Fee | NaN |
| State | Selangor |
| VideoAmt | 0 |
| PhotoAmt | 1.0 |
| AdoptionSpeed | B: 8-30 Days |
| AdoptionSpeedGranular | 8-30 Days |
Here are the configurations files for the tabular data:
attribution_analysis:
  attributions_every_sample_factor: 10
  compute_attributions: false
  max_attributions_per_class: 512
basic_experiment:
  memory_dataset: true
  n_epochs: 25
  output_folder: eir_tutorials/tutorial_runs/a_using_eir/tutorial_07_multimodal_run
  valid_size: 0.1
evaluation_checkpoint:
  checkpoint_interval: 200
  sample_interval: 200
optimization:
  gradient_clipping: 1.0
  lr: 0.0005
  optimizer: adamw
training_control:
  early_stopping_buffer: 2000
  early_stopping_patience: 5
  mixing_alpha: 0.2
input_info:
  input_source: eir_tutorials/a_using_eir/07_multimodal_tutorial/data/tabular.csv
  input_name: pets_tabular
  input_type: tabular

input_type_info:
  input_cat_columns:
          - Type
          - Breed1
          - Breed2
          - Gender
          - Color1
          - Color2
          - Color3
          - MaturitySize
          - State
          - FurLength
          - Vaccinated
          - Dewormed
          - Sterilized
          - Health
          - Fee

  input_con_columns:
          - Age
          - Quantity
          - VideoAmt
          - PhotoAmt

model_config:
  model_type: tabular
model_type: mlp-residual
model_config:
  layers:
  - 2
  rb_do: 0.25
output_info:
  output_source: eir_tutorials/a_using_eir/07_multimodal_tutorial/data/tabular.csv
  output_name: pet_adoption
  output_type: tabular

output_type_info:
  target_cat_columns:
    - AdoptionSpeed
  cat_label_smoothing: 0.1

model_config:
  model_init_config:
    layers:
      - 2
    fc_do: 0.25
    rb_do: 0.25
    stochastic_depth_p: 0.25
As usual, we can run the following command to train:
eirtrain \
--global_configs eir_tutorials/a_using_eir/07_multimodal_tutorial/conf/07_globals.yaml \
--input_configs eir_tutorials/a_using_eir/07_multimodal_tutorial/conf/07_input_tabular.yaml \
--fusion_configs eir_tutorials/a_using_eir/07_multimodal_tutorial/conf/07_fusion.yaml \
--output_configs eir_tutorials/a_using_eir/07_multimodal_tutorial/conf/07_output.yaml \
--07_globals.basic_experiment.output_folder=eir_tutorials/tutorial_runs/a_using_eir/tutorial_07a_multimodal_tabular \
--07_globals.attribution_analysis.compute_attributions=true
Note
Here we are setting the --compute_attributions=true parameter,
from the command line, to get the integrated gradients attributions of the
model w.r.t. the tabular input data.
When training, I got the following training curve:

Now, since we set the --compute_attributions=true parameter,
we can have a look at the attributions (notice in the global
configuration, we set compute_attributions_ever_sample_factor=10,
which means they are computed every
10 sampling iterations,
i.e. 200 * 10 = 2000 training iterations).
Specifically, we check the file under samples/4000/attributions/
in the results folder. First, we can have a look at the
feature importance for the tabular data.

Here we can see that Breed1 is the feature that most strongly influenced
the model’s prediction. In the attributions folder, we can also
see how the inputs influence the model towards a specific class.
Here, we will look at how the Breed1 input values influence the model
towards the class “D: 100+ Days”, meaning the pet was adopted
after 100 days:

So from this it seems that, unfortunately, mixed breed pets are less likely to be adopted (that is, the value “Mixed Breed” pushes the model towards making the “D: 100+ Days” prediction). This does perhaps make intuitive sense, but keep in mind that this is specifically analyzing the behavior of the model, and not guaranteed to be true, causal relationships. Additionally, this is something that could likely be discovered with simpler methods, such as a logistic regression model. However, this is just an example of how to use the integrated gradients attributions to analyze the deep-learning model.
B - Tabular + Text Data
Now, we will train the model on both tabular and text data. The text data in question are descriptions of the cute pets, which are stored in a CSV file.
Note
When reading sequence data from a CSV file, the file must follow the specification of having two columns, one containing the sequence IDs (“ID”), and the other containing the sequence data (“Sequence”). Note that the names of these columns are strictly enforced.
First, let’s take a look at an example from the text data:
Nibble is a 3+ month old ball of cuteness. He is energetic and playful. I rescued a couple of cats a few months ago but could not get them neutered in time as the clinic was fully scheduled. The result was this little kitty. I do not have enough space and funds to care for more cats in my household. Looking for responsible people to take over Nibble's care.
So to train on both tabular and text data, we will need to specify a configuration for the text data as well:
input_info:
  input_source: eir_tutorials/a_using_eir/07_multimodal_tutorial/data/descriptions.csv
  input_name: pet_descriptions
  input_type: sequence

input_type_info:
        sampling_strategy_if_longer: "uniform"
        max_length: "average"
        split_on: " "
        min_freq: 2
        tokenizer: "basic_english"
        tokenizer_language: "en"

model_config:
        model_type: sequence-default
        embedding_dim: 64
        position: embed
        pool: null
        model_init_config:
          num_heads: 4
          dropout: 0.2
Additionally, we will use a different fusion configuration:
model_type: attention
model_config:
  common_embedding_dim: 128
  dim_feedforward: auto
  dropout: 0.1
  n_heads: 8
  n_layers: 2
So, by default, EIR will use a MLP based module to fuse representations
from different input modalities. Another option is to use an attention-based
fusion module, where we project the different representations
onto a common embedding dimension, and then use transformer layers
to fuse the different representations.
Then to train, we simply include the new input configuration file
under the --input_configs parameter, as well as the new fusion:
eirtrain \
--global_configs eir_tutorials/a_using_eir/07_multimodal_tutorial/conf/07_globals.yaml \
--input_configs eir_tutorials/a_using_eir/07_multimodal_tutorial/conf/07_input_tabular.yaml eir_tutorials/a_using_eir/07_multimodal_tutorial/conf/07_input_description.yaml \
--fusion_configs eir_tutorials/a_using_eir/07_multimodal_tutorial/conf/07_fusion_attention.yaml \
--output_configs eir_tutorials/a_using_eir/07_multimodal_tutorial/conf/07_output.yaml \
--07_globals.basic_experiment.output_folder=eir_tutorials/tutorial_runs/a_using_eir/tutorial_07b_multimodal_tabular_description
Now, when training, we get the following training curve:

So here we can see that the model seems to perform slightly better when trained on both tabular and text data. We also start to see possible signs of overfitting, as the training curve starts to diverge from the validation curve.
C - Tabular + Text + Image Data
Now, we will train the model on all three types of data: tabular, text, and image. The image data is stored in a folder, where each image is stored in a separate file.
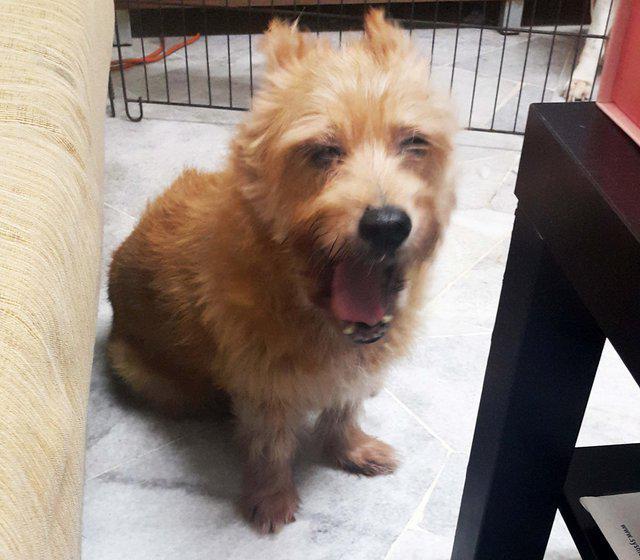
As before, let’s have a quick look at an example image:
Configuration file for the image data:
input_info:
  input_source: eir_tutorials/a_using_eir/07_multimodal_tutorial/data/images
  input_name: cute_pet_images
  input_type: image

input_type_info:
  mixing_subtype: "cutmix"
  size:
    - 128

model_config:
  model_type: "resnet18"
  pretrained_model: True
  freeze_pretrained_model: True
Note
Here we are using a pre-trained ResNet-18 model
to extract the image features. We are using the
--pretrained_model parameter to specify the
that we want to use pre-trained weights.
We are also using the --freeze_pretrained_model parameter
to freeze the weights of the pre-trained model,
so that they are not updated during training.
And then we can train the model on all three types of data:
eirtrain \
--global_configs eir_tutorials/a_using_eir/07_multimodal_tutorial/conf/07_globals.yaml \
--input_configs eir_tutorials/a_using_eir/07_multimodal_tutorial/conf/07_input_tabular.yaml eir_tutorials/a_using_eir/07_multimodal_tutorial/conf/07_input_description.yaml eir_tutorials/a_using_eir/07_multimodal_tutorial/conf/07_input_image.yaml \
--fusion_configs eir_tutorials/a_using_eir/07_multimodal_tutorial/conf/07_fusion_attention.yaml \
--output_configs eir_tutorials/a_using_eir/07_multimodal_tutorial/conf/07_output.yaml \
--07_globals.basic_experiment.output_folder=eir_tutorials/tutorial_runs/a_using_eir/tutorial_07c_multimodal_tabular_description_image
Note
Here we are setting the device parameter to cuda:0,
to train on the GPU. If you do not have a GPU, you can
skip this parameter, or set it to cpu. Note that
training on the CPU will likely be much slower, especially
now that we are training on images as well.
When training, we get the following training curve:

So in this case, including the image data does not seem to improve the performance of the model further compared to the model trained on the tabular and text data. However, it does seem that the validation performance more quickly reaches peak performance when including the image data. It might be interesting to try training on the image data alone, to how much performance we can get from that. Furthermore, one could try unfreezing the pre-trained model, and see if that improves the performance. However, this tutorial is getting long enough already, so we will leave that as an exercise for those interested.
D - Serving
This section guides you through serving a multimodal model that combines tabular data, text descriptions, and images. We’ll demonstrate how to interact with this served model using HTTP requests.
Starting the Web Service
To serve the multimodal model, use the following command:
eirserve --model-path [MODEL_PATH]
Replace [MODEL_PATH] with the actual path to your trained multimodal model. This command starts a web service that listens for incoming HTTP requests.
Example of the serving command:
eirserve \
--model-path eir_tutorials/tutorial_runs/a_using_eir/tutorial_07c_multimodal_tabular_description_image/saved_models/tutorial_07c_multimodal_tabular_description_image_checkpoint_1200_perf-average=0.4196.pt
Sending Requests
With the server running, we can now send requests. For this multimodal model, we send a combination of tabular data, description text, and an image encoded in base64 in a batched format.
Here’s an example Python function demonstrating this process:
import base64
from copy import deepcopy
from io import BytesIO

import requests
from PIL import Image


def encode_image_to_base64(file_path: str) -> str:
    with Image.open(file_path) as image:
        buffered = BytesIO()
        image.save(buffered, format="JPEG")
        return base64.b64encode(buffered.getvalue()).decode("utf-8")


def send_request(url: str, payload: list[dict]) -> dict:
    response_ = requests.post(url, json=payload)
    response_.raise_for_status()
    return response_.json()


base = {
    "pets_tabular": {
        "Type": "Cat",
        "Name": "Nibble",
        "Age": 1.0,
        "Breed1": "Tabby",
        "Breed2": "0",
        "Gender": "Male",
        "Color1": "Black",
        "Color2": "White",
        "Color3": "0",
        "MaturitySize": "Small",
        "FurLength": "Short",
        "Vaccinated": "No",
        "Dewormed": "No",
        "Sterilized": "No",
        "Health": "Healthy",
        "Quantity": 1.0,
        "Fee": "Free",
        "State": "Selangor",
        "VideoAmt": 0.0,
        "PhotoAmt": 1.0,
    },
    "pet_descriptions": "A super cute tabby cat!!!",
    "cute_pet_images": encode_image_to_base64(
        "eir_tutorials/a_using_eir/07_multimodal_tutorial/data/images/86e1089a3.jpg"
    ),
}

payload = [deepcopy(base)]

response = send_request(url="http://localhost:8000/predict", payload=payload)
print(response)
When running this, we get the following output:
{
    "result": [
        {
            "pet_adoption": {
                "AdoptionSpeed": {
                    "A: 0-7 Days": 0.3055402338504791,
                    "B: 8-30 Days": 0.22344061732292175,
                    "C: 31-90 Days": 0.18260253965854645,
                    "D: 100+ Days": 0.28841665387153625
                }
            }
        }
    ]
}
Analyzing Responses
After sending requests to the served model, you will receive responses that provide a prediction based on the combined data (tabular, description, and image).
Let’s take a look at some example predictions made by the model:
[
    {
        "request": [
            {
                "pets_tabular": {
                    "Type": "Cat",
                    "Name": "Nibble",
                    "Age": 1.0,
                    "Breed1": "Tabby",
                    "Breed2": "0",
                    "Gender": "Male",
                    "Color1": "Black",
                    "Color2": "White",
                    "Color3": "0",
                    "MaturitySize": "Small",
                    "FurLength": "Short",
                    "Vaccinated": "No",
                    "Dewormed": "No",
                    "Sterilized": "No",
                    "Health": "Healthy",
                    "Quantity": 1.0,
                    "Fee": "Free",
                    "State": "Selangor",
                    "VideoAmt": 0.0,
                    "PhotoAmt": 1.0
                },
                "pet_descriptions": "A super cute tabby cat!!!",
                "cute_pet_images": "eir_tutorials/a_using_eir/07_multimodal_tutorial/data/images/86e1089a3.jpg"
            },
            {
                "pets_tabular": {
                    "Type": "Cat",
                    "Name": "Nibble",
                    "Age": 5.0,
                    "Breed1": "Tabby",
                    "Breed2": "0",
                    "Gender": "Male",
                    "Color1": "Black",
                    "Color2": "White",
                    "Color3": "0",
                    "MaturitySize": "Small",
                    "FurLength": "Short",
                    "Vaccinated": "No",
                    "Dewormed": "No",
                    "Sterilized": "No",
                    "Health": "Healthy",
                    "Quantity": 1.0,
                    "Fee": "Free",
                    "State": "Selangor",
                    "VideoAmt": 0.0,
                    "PhotoAmt": 1.0
                },
                "pet_descriptions": "A super cute tabby cat!!!",
                "cute_pet_images": "eir_tutorials/a_using_eir/07_multimodal_tutorial/data/images/86e1089a3.jpg"
            },
            {
                "pets_tabular": {
                    "Type": "Cat",
                    "Name": "Nibble",
                    "Age": 10.0,
                    "Breed1": "Tabby",
                    "Breed2": "0",
                    "Gender": "Male",
                    "Color1": "Black",
                    "Color2": "White",
                    "Color3": "0",
                    "MaturitySize": "Small",
                    "FurLength": "Short",
                    "Vaccinated": "No",
                    "Dewormed": "No",
                    "Sterilized": "No",
                    "Health": "Healthy",
                    "Quantity": 1.0,
                    "Fee": "Free",
                    "State": "Selangor",
                    "VideoAmt": 0.0,
                    "PhotoAmt": 1.0
                },
                "pet_descriptions": "A super cute tabby cat!!!",
                "cute_pet_images": "eir_tutorials/a_using_eir/07_multimodal_tutorial/data/images/86e1089a3.jpg"
            },
            {
                "pets_tabular": {
                    "Type": "Cat",
                    "Name": "Nibble",
                    "Age": 3000.0,
                    "Breed1": "Tabby",
                    "Breed2": "0",
                    "Gender": "Male",
                    "Color1": "Black",
                    "Color2": "White",
                    "Color3": "0",
                    "MaturitySize": "Small",
                    "FurLength": "Short",
                    "Vaccinated": "No",
                    "Dewormed": "No",
                    "Sterilized": "No",
                    "Health": "Healthy",
                    "Quantity": 1.0,
                    "Fee": "Free",
                    "State": "Selangor",
                    "VideoAmt": 0.0,
                    "PhotoAmt": 1.0
                },
                "pet_descriptions": "A super cute tabby cat!!!",
                "cute_pet_images": "eir_tutorials/a_using_eir/07_multimodal_tutorial/data/images/86e1089a3.jpg"
            }
        ],
        "response": {
            "result": [
                {
                    "pet_adoption": {
                        "AdoptionSpeed": {
                            "A: 0-7 Days": 0.3055402338504791,
                            "B: 8-30 Days": 0.22344061732292175,
                            "C: 31-90 Days": 0.18260253965854645,
                            "D: 100+ Days": 0.28841665387153625
                        }
                    }
                },
                {
                    "pet_adoption": {
                        "AdoptionSpeed": {
                            "A: 0-7 Days": 0.29994577169418335,
                            "B: 8-30 Days": 0.22241567075252533,
                            "C: 31-90 Days": 0.18271800875663757,
                            "D: 100+ Days": 0.2949204742908478
                        }
                    }
                },
                {
                    "pet_adoption": {
                        "AdoptionSpeed": {
                            "A: 0-7 Days": 0.2931397259235382,
                            "B: 8-30 Days": 0.22110803425312042,
                            "C: 31-90 Days": 0.18275190889835358,
                            "D: 100+ Days": 0.30300039052963257
                        }
                    }
                },
                {
                    "pet_adoption": {
                        "AdoptionSpeed": {
                            "A: 0-7 Days": 0.03522421792149544,
                            "B: 8-30 Days": 0.06184985116124153,
                            "C: 31-90 Days": 0.08584997802972794,
                            "D: 100+ Days": 0.8170759081840515
                        }
                    }
                }
            ]
        }
    }
]
You can see that the inputs to the models are basically identical, except that we are varying the age of the pet. The general trend is that the older the pet, the longer it takes to be adopted, according to the model. This, unfortunately, is perhaps not surprising and is particularly visible when we increase the age to the extreme of 3000 months (250 years) – I mean, who would not want to adopt a 250 year old sage cat? :)
While not visible in the JSON above, here is the image used:

86e1089a3.jpg
That is it for the main part of the tutorial. I hope you enjoyed it! Below are a couple of appendixes with some additional experiments that might be interesting.
Appendix A - Adding a pre-trained text feature extractor
In this appendix, we will add a pre-trained text feature extractor in addition to the one we already have. We will be using a pre-trained Tiny BERT model (see (see Established Architectures and Pretrained Models for more information). It is not certain whether this will improve the performance of the model, but the idea is more to showcase some functionalities of the framework.
Here is the configuration file for the pre-trained text feature extractor:
input_info:
  input_source: eir_tutorials/a_using_eir/07_multimodal_tutorial/data/descriptions.csv
  input_name: pet_descriptions_pretrained
  input_type: sequence

input_type_info:
  sampling_strategy_if_longer: "uniform"
  max_length: 64
  split_on: " "
  min_freq: 10

model_config:
    model_type: "prajjwal1/bert-tiny"
    pretrained_model: true
    freeze_pretrained_model: true
    position: embed
    pool: avg
The command:
eirtrain \
--global_configs eir_tutorials/a_using_eir/07_multimodal_tutorial/conf/07_globals.yaml \
--input_configs eir_tutorials/a_using_eir/07_multimodal_tutorial/conf/07_input_tabular.yaml eir_tutorials/a_using_eir/07_multimodal_tutorial/conf/07_input_description.yaml eir_tutorials/a_using_eir/07_multimodal_tutorial/conf/07_apx-a_input_description_pretrained.yaml eir_tutorials/a_using_eir/07_multimodal_tutorial/conf/07_input_image.yaml \
--fusion_configs eir_tutorials/a_using_eir/07_multimodal_tutorial/conf/07_fusion_attention.yaml \
--output_configs eir_tutorials/a_using_eir/07_multimodal_tutorial/conf/07_output.yaml \
--07_globals.basic_experiment.output_folder=eir_tutorials/tutorial_runs/a_using_eir/tutorial_07-apx-a_multimodal_tabular_description_pretrained
The training curve:

So it seems that the pre-trained text feature extractor does not help, and likely we are even overfitting a bit more!
Appendix B - Multi-modal, multi-task learning
In this part, we will train the model to not only predict the adoption speed, but also the pet’s age and number of pets in the image. For this, we have to modify the tabular input and output configurations:
input_info:
  input_source: eir_tutorials/a_using_eir/07_multimodal_tutorial/data/tabular.csv
  input_name: pets_tabular
  input_type: tabular

input_type_info:
  input_cat_columns:
          - Type
          - Breed1
          - Breed2
          - Gender
          - Color1
          - Color2
          - Color3
          - MaturitySize
          - State
          - FurLength
          - Vaccinated
          - Dewormed
          - Sterilized
          - Health
          - Fee

  input_con_columns:
          - VideoAmt
          - PhotoAmt

model_config:
  model_type: tabular
output_info:
  output_source: eir_tutorials/a_using_eir/07_multimodal_tutorial/data/tabular.csv
  output_name: pet_adoption
  output_type: tabular

output_type_info:
  target_cat_columns:
    - AdoptionSpeed
  target_con_columns:
    - Age
    - Quantity
  cat_label_smoothing: 0.1
Note that we have moved the features that we want to predict from the input configuration to the output configuration.
The command:
eirtrain \
--global_configs eir_tutorials/a_using_eir/07_multimodal_tutorial/conf/07_globals.yaml \
--input_configs eir_tutorials/a_using_eir/07_multimodal_tutorial/conf/07_apx-b_mt_input_tabular.yaml eir_tutorials/a_using_eir/07_multimodal_tutorial/conf/07_input_description.yaml eir_tutorials/a_using_eir/07_multimodal_tutorial/conf/07_apx-a_input_description_pretrained.yaml eir_tutorials/a_using_eir/07_multimodal_tutorial/conf/07_input_image.yaml \
--fusion_configs eir_tutorials/a_using_eir/07_multimodal_tutorial/conf/07_fusion_attention.yaml \
--output_configs eir_tutorials/a_using_eir/07_multimodal_tutorial/conf/07_apx-b_mt_output.yaml \
--07_globals.basic_experiment.output_folder=eir_tutorials/tutorial_runs/a_using_eir/tutorial_07-apx-b_multimodal_tabular_description_multi_task
First we can have a look at the average performance:

Note
The average performance by default is the average of the MCC, ROC-AUC and average precision (AP) for categorical targets and 1.0-LOSS, PCC, R2 for continuous targets.
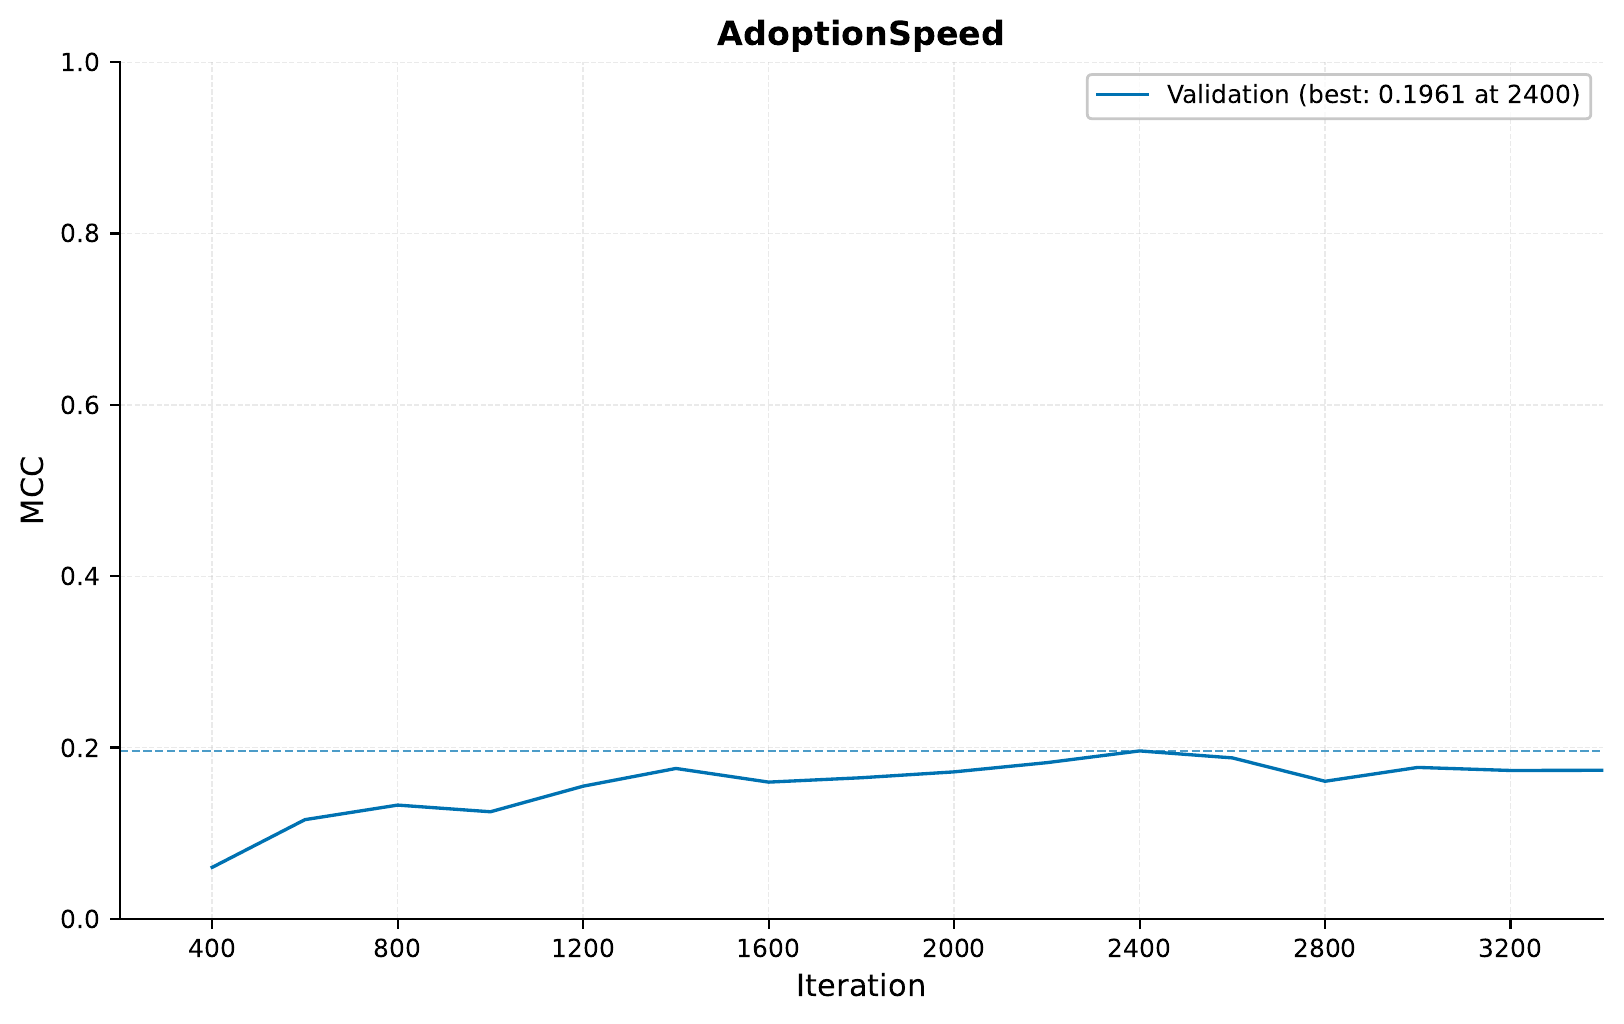
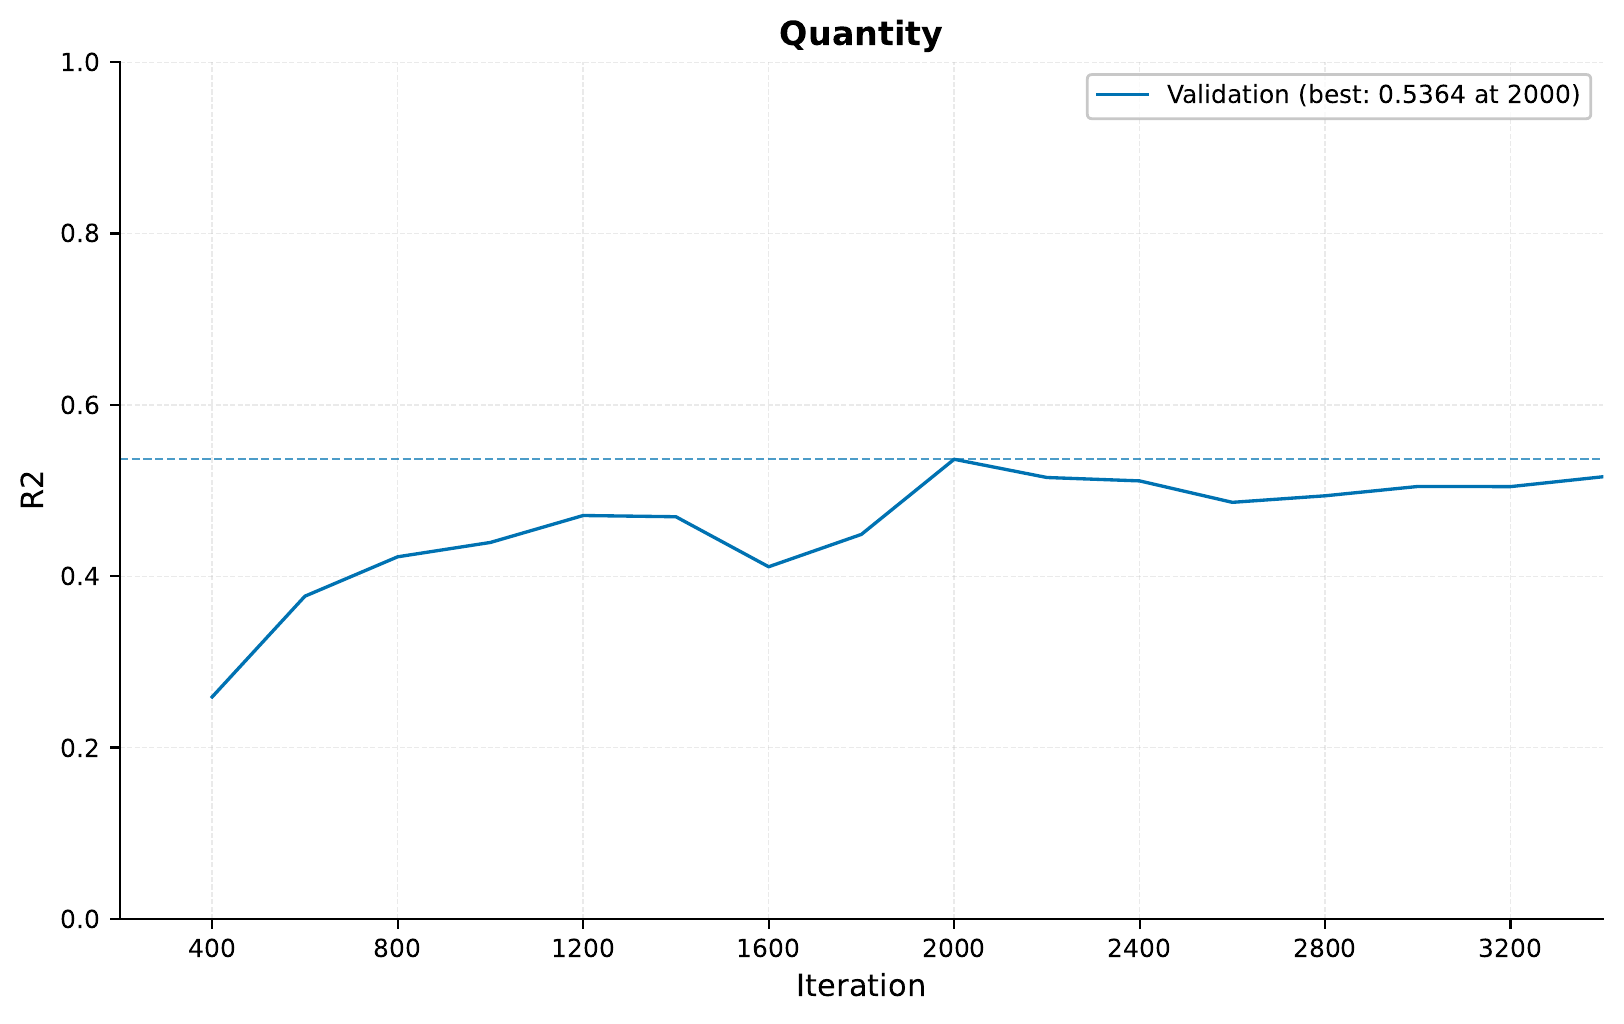
So, since we are using different inputs and outputs in this task, we cannot compare directly to the previous results. However, we can see that the model seems to be able to learn to predict the 3 different targets fairly well.
The training curves for the adoption speed, age and quantity:

Finally, we can also look at the regression predictions
by checking the samples folder for the Age and Quantity
targets. Here are a couple of examples:

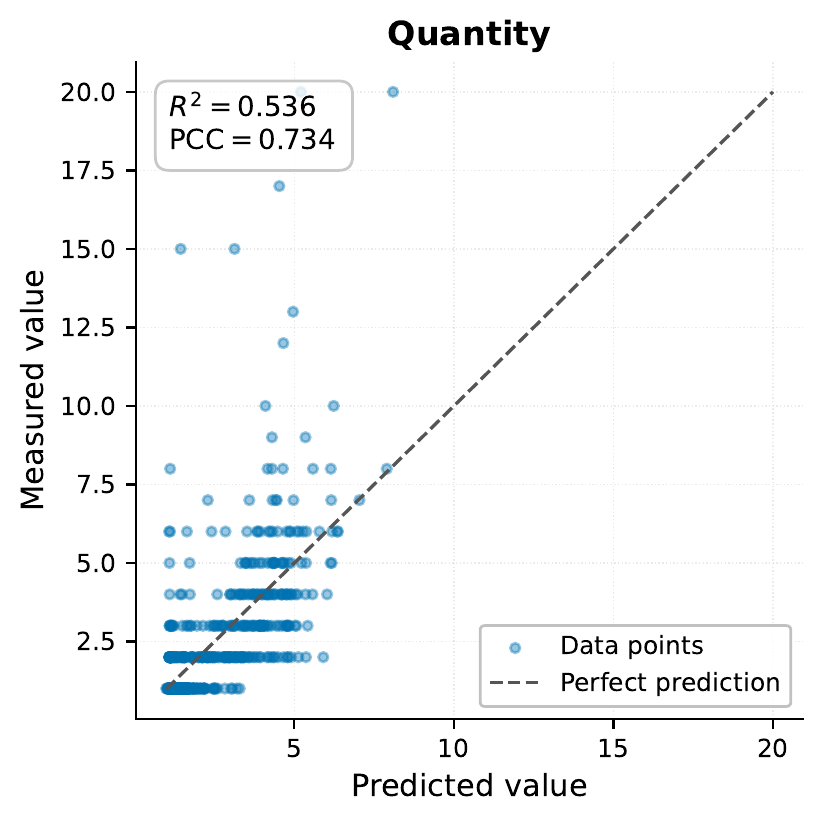
So in the case of quantity, it is expected that the model gets some of the predictions wrong, since in our parsed data we are only using randomly chosen one image, but the original data includes multiple images (it can also be that it can learn some of this from the descriptions). However, the model seems to be able to predict the quantity fairly well, and same for the age.